
Security Testing With Web Developer Tools
by Eric Anderson
Burp Suite is the go-to tool to slice and dice web interactions. But sometimes loading up Burp (with all the weight of Java), setting up a proxy (even if FoxyProxy helps a lot), etc feels too heavy. If we are doing full-fledged hacking we may have Kali booted up in a VM but on our day-to-day driver we often don’t have Burp handy. Is there a fallback approach that can help us out?
This article will demonstrate using the browser’s web developer tools for investigating the security of web apps. Although web developer tools aren’t designed for hacking, they can act as a “Burp lite” in a pinch. Furthermore because it can interact with the web app rather than just watch and manipulate the traffic there are even some ways in which it can exceed Burp.
Every major browser has web developer tools available since web developers need them to debug and optimize websites. This means they are always available, be it your daily driver or a workstation you are using for temp purposes. Knowing these tools may not give you the Swiss Army Knife of Burp, but it still is a useful blade that is always with you.
The following article is just an introduction to using Web Developer Tools for investigating the security of an application. I encourage you to explore these tools to see what uses you can find. Some of the examples given below may be a bit pedesterian as they are just meant for explaination and demostration purposes. But the concepts they are employing can be carried over to more advanced manipulation of real world web applications.
Activating the Tools
Depending on the browser, activating the web developer tools can differ. It should be accessible via a menu. For example, in Firefox you can access them in the “More tools” sub-menu.
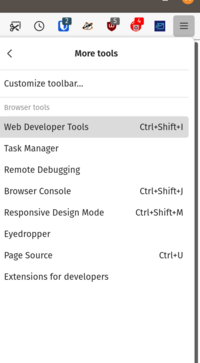 Accessing Web Developer Tools on Firefox
Navigating menus is slow. Learning the keyboard shortcut gives you a better flow. In the case of Firefox, you can activate it with <Ctrl>-<Shift>-I. In Chrome, use <Ctrl>-<Shift>-J.
Once activated, it will show up docked (usually the side or bottom) looking something like this:
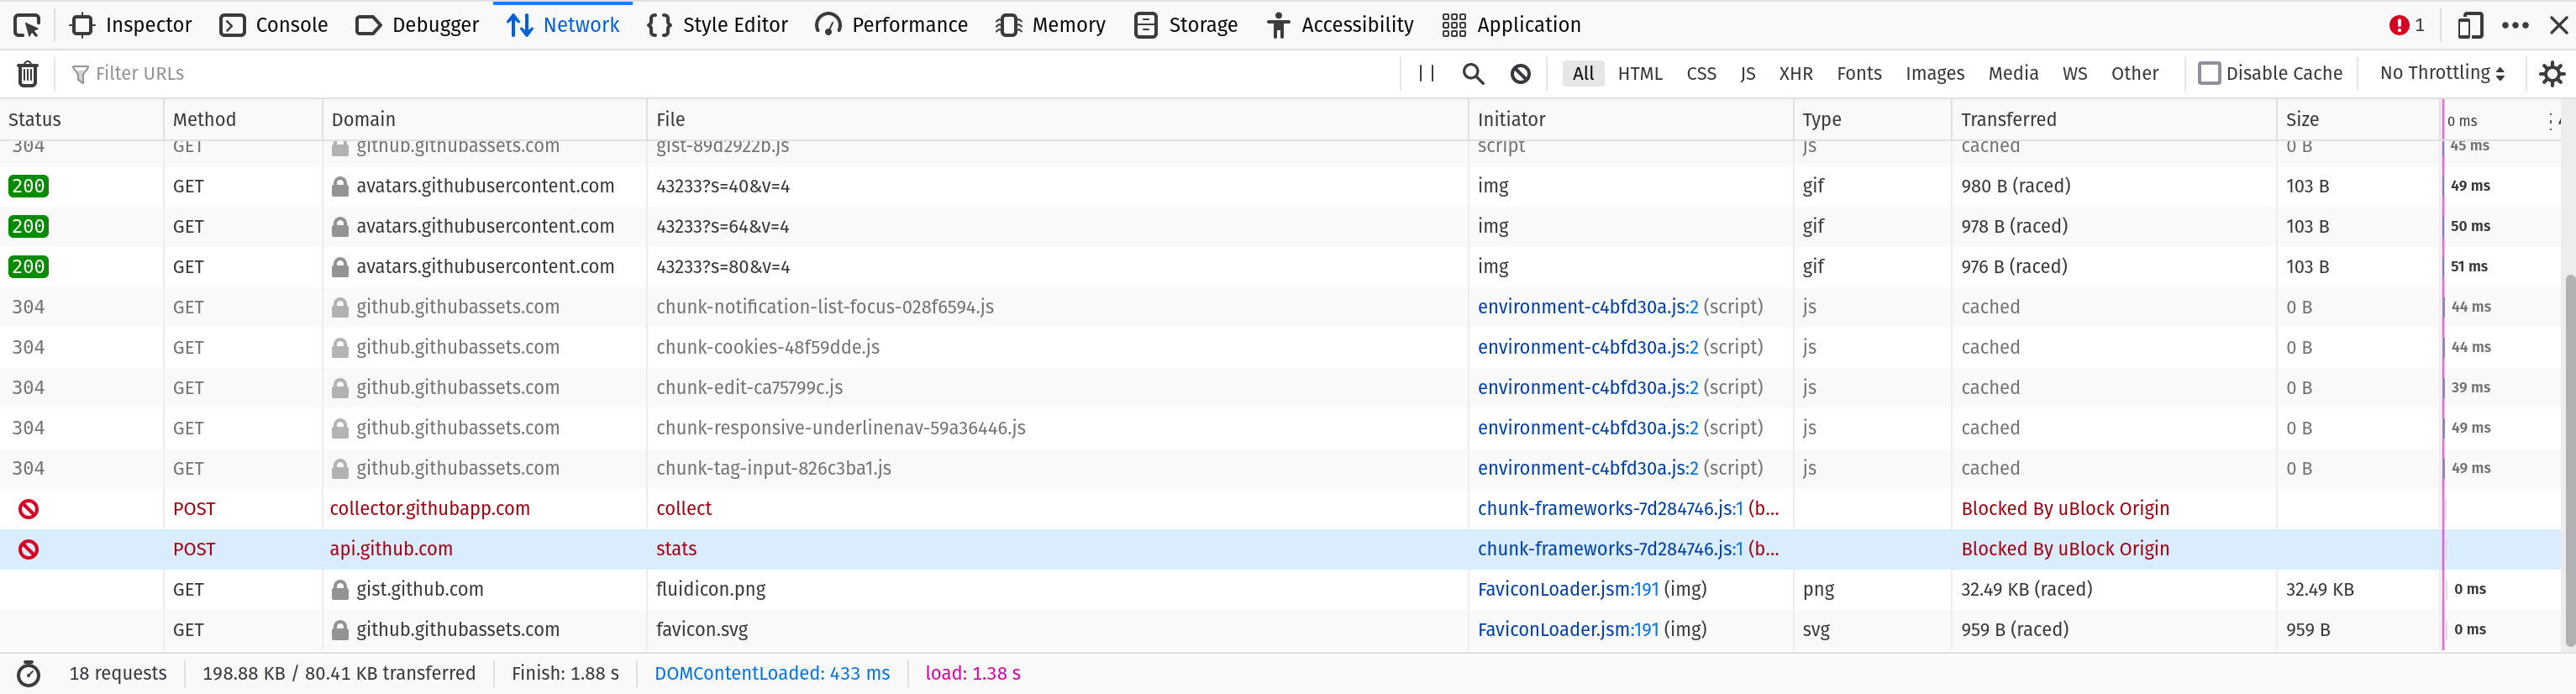 Different browsers have different features and look a bit different. Above is how things look in Firefox. Since you may be using different browsers at different times I suggest you get familar with the dev tools on all browsers. This guide will use Firefox as an example but the concepts carry over to Chome, Edge, and Safari.
Let’s dig into the tools.
Inspector
Called “Elements” in Chrome, this provides a way to navigate and live edit the DOM. What is the DOM? It is the in-memory representation of the HTML document. For example, if your markup is:
<p><strong>Hello<strong>World</p>
The DOM will look like:
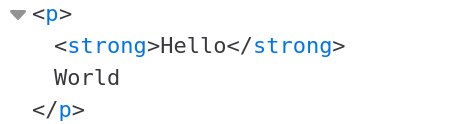 DOM constructed from markup
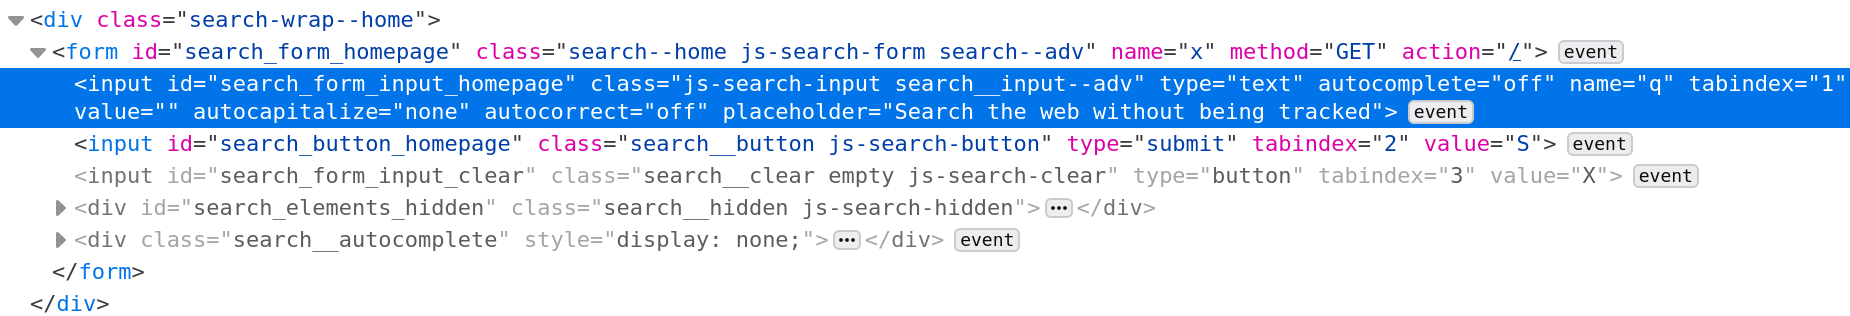
How can we use the DOM tree for security analysis? First, we can use it to understand the structure of the page via the Element Selector tool. The Element Selector tool can be activated by clicking  .
.
Once you click it you can move your mouse around the page to highlight different elements on the page:
 DOM Selector Highlighting Elements
Click the element you want and the DOM tree navigates to that element:
 Selected Element Found in DOM tree
This is important in two ways:
- Even though “View Source” will provide you the HTML source code for a page it can be tough to navigate a complex document with thousands of elements. The selector helps you zero in on just the part of the page you are interested in.
- “View Source” in modern web applications is not the full story. Often the DOM is constructed and manipulated via JavaScript. This means elements may be on the page but not present if you just view the HTML source. This is especially true for single-page apps (SPAs) where all page rendering happens via a client-side framework such as React, Vue or Svelte.
How is being able to navigate the DOM useful? For one, it can reveal hidden fields and hidden content. The DOM has all content in memory not just what the user can see. The St. Louis Dispatch famously showed how social security numbers were available on a state website in hidden content. It’s not clear if they were viewable in the raw HTML downloaded but if they weren’t they would certainly have been viewable in the DOM.
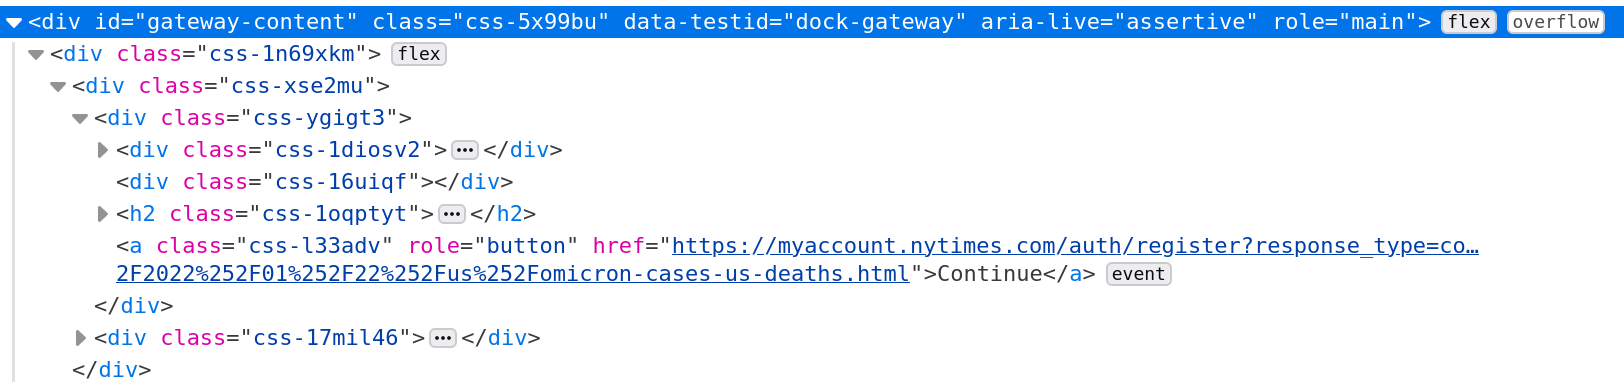
Another way the Inspector tab is useful is the fact that the DOM can be live edited. This allows you to adjust the page in real time and then continue using your modified web app. For example, the New York Times has a paywall:
 Paywall Overlay
Looking at the DOM we can see the entire article is still sent to the user. It just has the signup options overlaying the article. With the element selector we can find the top-level container for that signup overlay:
 Overlay in the DOM
Once that node is found hit the Delete key. Now the overlay is gone. We still have a bit more work to do. It won’t let us scroll through the article. A bit more searching and we find the styles that are preventing that scrolling:
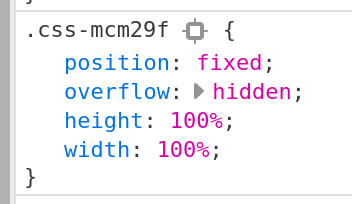 Click the check mark next to each style to disable (will become crossed out):
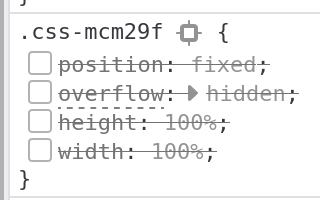 Scroll Prevention Disabled
Now we can scroll through the article normally. One final tweak there is a gradient over the top of the article we want to get rid of:
 Disabled Gradient
Disable that style and now we can read the article without the paywall.
This principal of modifying the HTML and CSS (deleting, editing, disabling) can be used in many situations. Maybe a button is disabled but if we just re-enable it then we gain access to something we shouldn’t be able to. Maybe a hidden field contains information that if modified will update the database in a way it shouldn’t.
Sure we could capture the network traffic with Burp, modify the HTTP request and then re-send our modified request. Or we can just edit the form itself and then use the application against itself.
Console
The console is another important tool. This gives you a way to script behavior on a page. For example, we can automate removing the paywall on the NYT article with the following JS:
$('#gateway-content').remove()
Object.entries({
  'position': 'static',
  'overflow': 'visible',
  'width': 'auto',
  'height': 'auto'
}).forEach(([style, value]) => $('.css-mcm29f').style[style] = value)
$('.css-gx5sib').style.background = 'transparent'
Now we can just run that script to remove the paywall. Convert it to a bookmarklet and it becomes just a button click.
Side Note: Two of the CSS selector names look generated so this script is likely to break the future. With a bit more effort you could probably create one a bit more future-proof but this is just for demonstration so I’ll leave that to the reader.
The other really useful thing about the console besides automating page changes is the ability to run page-defined JavaScript functions. Many web apps often have two important characteristics:
- Functions are often defined in the global space so you can simply call them from the console.
- All the JavaScript tends to be bundled up in a single file for performance reasons, even JS unrelated to the current page (such as admin functions).
This will be less true as time marches forwards. JS modules are isolating scripts from each other and HTTP/2 now means delivering many small files can be better than one large file. But change happens slowely so at least for the immediate future you might find useful functions available in the global scope that when called from the console to execute certain application behavior for you. This is how I got my initial account for Hack the Box.
Debugger
Called “Sources” in Chrome, if you are dealing with a newer page that is not exposing its JS as global functions you can perhaps still take over existing functions via the debugger. For example in the popular Wordle game there is a line that determines what the date for the first Wordle game. It uses this date to determine the answer for today’s Wordle.
 Let’s say I want to play tomorrow’s game today because I’m going to be away from a computer tomorrow. I can do that by manipulating this start date and therefore manipulating what answer the game is looking for.
Editing this date via the Console is not really possible as it is defined in a closure and therefore not in the global scope. But I can set a breakpoint on that line. Reload the page and it will stop at that line while the page is loading. Step to the next line and then type the following the console:
Ha = new Date(2021, 5, 18, 0, 0, 0, 0)
This has the effect of overwriting the value of Ha that had just be assigned by the script with our desired value (one day earlier). Now we let the script continue running as normal and we can play tomorrow’s game today! This same principal can be applied in less benign ways. Find a key point to set a breakpoint, manipulate the data in memory or call a function now in scope to use the application’s own code against itself.
Pro-tip: To understand the JavaScript you are trying to manipulate you are going to have to read the source code. In modern web applications it is often “minimized” which means any information not used to execute the program (such as long identifiers, line breaks, etc) is removed. This can make reading it hard. Although the identifiers cannot be restored at least the source can be formatted via the pretty-print tool. In Firefox it looks like  .
.
Networking
If you are looking for a tab that most closely resembles the core functionality of Burp you want the networking tab. This will show you every request made and response received. For each request you can see:
- Headers sent/received
- Cookies sent/received
- Request data sent
- Response data received
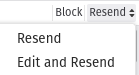
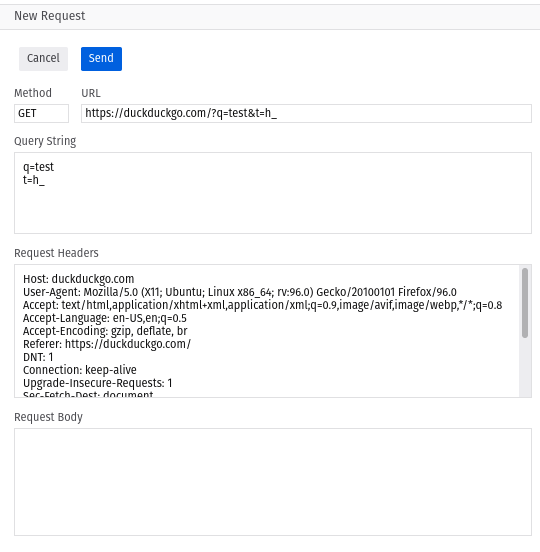
Even more powerful is the “Edit and Resend” options which lets you adjust the HTTP request and send it allowing you to make subtle changes to the network data just like in Burp.
 Menu to Activate
 “Edit and Resend” Interface
Also very useful is the “Copy as cURL” command which will paste to your clipboard a cURL command that you can paste into the command line to repeat the request. Useful to incorporate into shell scripts, pipe the response, etc.
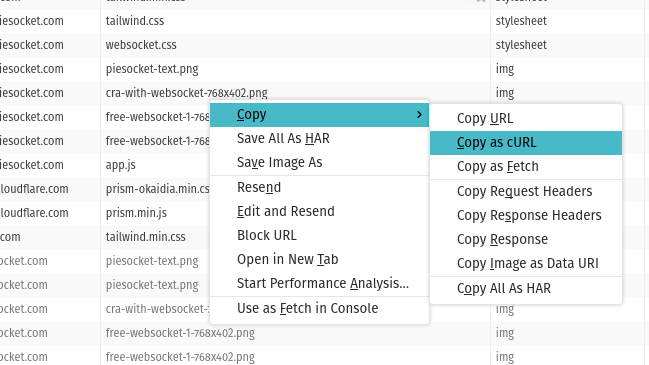 Copy cURL Command to Clipboard
Storage
The storage tab is another critical tool. Browsers offer a number of ways for websites to store data. The differences between different types of storage are outside the scope of this article but the two most important things are:
- The web developer tools allow you to manually add/edit/delete items from these storage facilities.
- Some web applications assume any data stored is data the application put there and therefore is trusted.
Combine these two things together and you can often manipulate the application by modifying the data it trusts but shouldn’t. Maybe the user’s role in the application is stored as a cookie and by switching it from User to Admin you can gain additional access. Maybe you can capture a session from another person (maybe via XSS). Once you have that session identifier you can simply replace your session identifier with theirs and now you are logged in as them and can use the application as that other person.
Looking at the Wordle app again we see the statistics are stored client-side and completely trusted. It is stored in “local storage” which is a key/value store available in browsers. Just double click on the value and we can edit it:
 Editing Wordle Storage
Now we can be the best Wordle player of all time:
 Improbable Wordle Score